Used Tractor valuation has always been a challenge. The attempt is constantly to metricize, templatize and simplify the valuation process. They buyer and seller need to conclusively arrive at a value. Today, majority of us use one of the following methods to build a grid
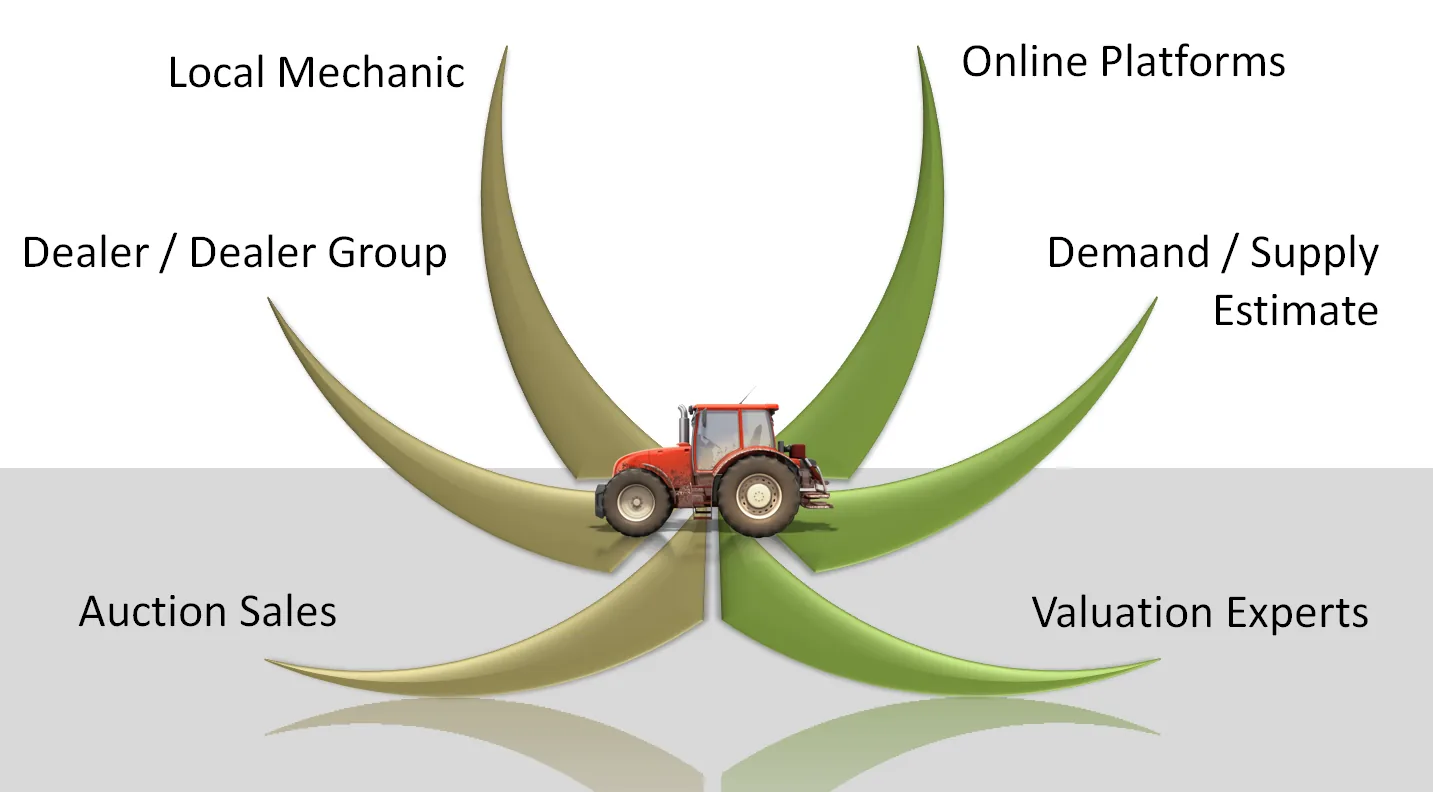
While all of them provide us a basis for funding and give us an intrinsic value, each financier has a different risk appetite, a different market to cater to, and a different strategy. Hence, determining the funding amount is critical.
In the current day context, the used tractor funding ranges between 60 - 75% of value determined. So what is the problem with the models adopted above ?
- The sample size needs to be considered HP wise and Model Segment wise. The sample size on the basis of which inputs are provided are never adequate. If we were to use the Central Limit Theorem, a size of 30 transactions considered wtihin a radius of 100 kms, would broadly fit the requirement. Else, we are relying on a selective pattern of sale that has been observed.
- Depreciation differs based on demand and supply. Caveat Emptor holds good here....Buyer Beware !!
- Law of Averages. The used market generally targets tractors between 3 - 6 years. The problems in this segment is broadly known for the respective model and hence traded thereon.
While these were being presented, a whole bunch of additional inputs were presented which came from different sources. I prefer to call each source a school of thought. So here I present what each school of thought gave me to understand. Through my journey as an avid student of the subject, these were learnt and used and merely share my understanding / jottings on the subject as a passionate learner.
SCHOOL OF THOUGHT 1 - Point of Sale Psychology
Broadly all usages can be classified into 2 types - Agricultural and Commercial Usage / Contractual. The HMR patterns for each differ. However, if we presume
(a) HP for Agri is less than 45 Hp
(b) PTO Load is between 65 - 80% of PTO Hp, Eg : PTO Hp of a 45 HP is 38 Hp. So, if implement (inclusive of draft) / work load is 22 - 30 Hp equivalent.
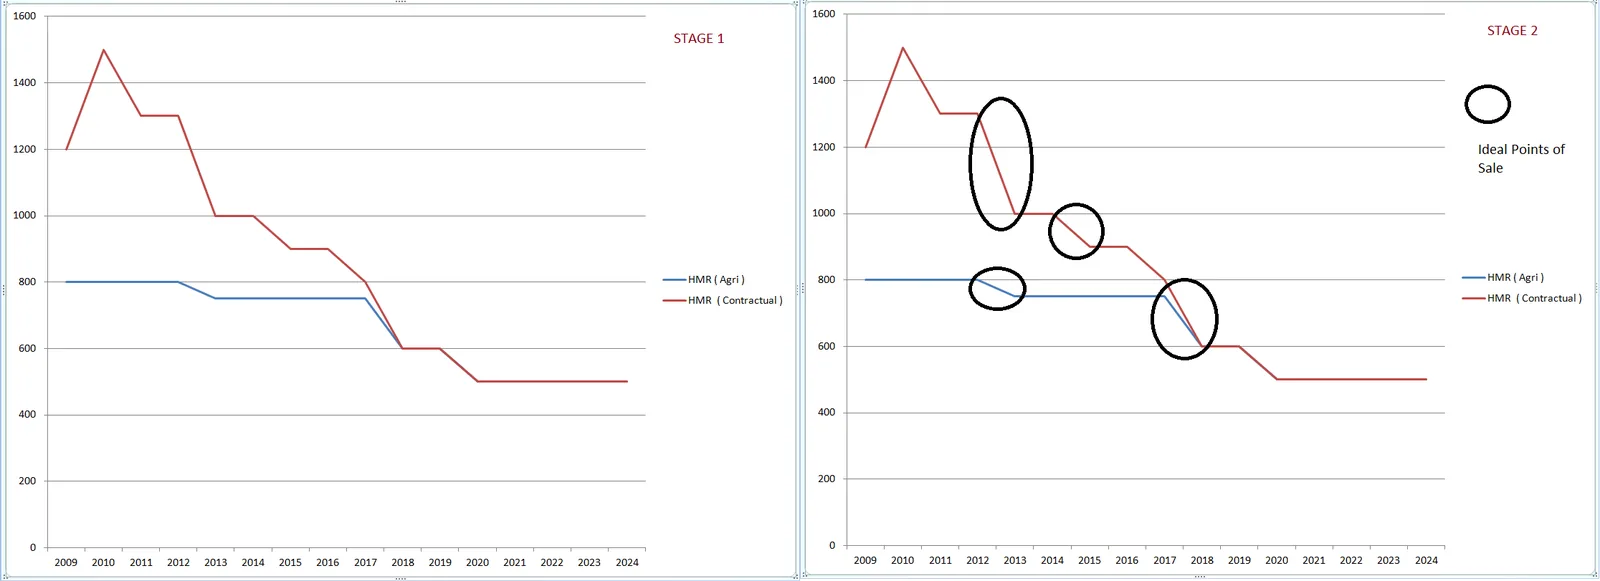
There will be "Points of Sale", where the propensity to sell off the tractor is high. This has been observed to be higher typically between 3rd - 5th year after sale, thereafter 7th year and then 9th year. While the reason for the dip in HMR still remains to be unravelled fully, the proximate rationale given is the costs. The usage in the first 3 -5 years of the tractors depending on brand and technology, yields itself to rugged use and thereafter settles down to regular haulage / 600 - 800 Hour use. If pushed beyond, the costs of maintenance increases.
Additional input, also, is that a shift / extension of life is observed if skilled, single driver uses the vehicle over an extended period of time. Change is skill level of drivers, frequently clubbed with wear and tear and handling causes a change in life of the vehicle.
It has been observed that, it is possible to keep extracting work from a tractor, even in the 15th year, and beyond. Yet in cases, where such usages have been found, moderation of usage to about 450 - 500 hours per annum with maintenance has been found to be key and critical.
SCHOOL OF THOUGHT 2 - APPLICATION OF DEPRECIATION
Depreciation in the practical world is considered as “mark-down” in value of the tractor / asset, from the value paid for it at the time of purchase. This “mark down” takes different basis :
(a) Linear Depreciation
(b) Financial Depreciation
(c) Load Based Depreciation
(d) Demand and Supply Depreciation
Linear Depreciation :
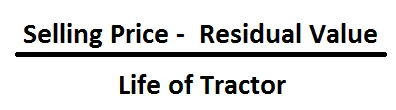
Where the Residual value is considered as 10% of the Selling Price.
Let us understand this with an example.
Let us take the case of tractor with a value of Rs. 5 Lakhs, in 2009. Today, in 2019, we take the residual value to be Rs. 50000. We take the life of tractor by the engineering method to be 15 years. So per annum depreciation is about Rs. 30000/-.
Financial Depreciation :
This takes up a first year depreciation of 15% due to surge in usage. It is recorded, that in order to maximize returns in the first year, the asset is put to a high amount of rigour and load. Thereafter the depreciation applied is at about 8%.
Load Based Depreciation :
This theory believes that the tractor should function at approximately 85% of its PTO load capacity. So a 45 Hp vehicle, should have a workload equivalent of approximately 38 Hp. If it is lower, the wear and tear is higher, and energy is generated in excess of requirements, which causes quicker fatigue in all links including gears and implements.
This theory believes that lesser the load, higher the fatigue and hence higher the depreciation and lower the life of the asset. The need for changing parts will be quicker and need for investing in change will need to be factored.
Demand and Supply Based Depreciation :
This school of thought believes firmly that tractors typically can used well for a period of 12 years with an 8 per cent average depreciation. It is believed that popularity of the model largely determines the depreciation factor. When models having a sale of 35 – 40 units were considered, and their sale values were registered, and average of 8% depreciation was found to be applicable. The depreciation was higher when the lot size decreased.
For Eg : if we considered models having a sale of 5 – 10 units the depreciation was higher though the HP was the same.
Hence when we compared the depreciation values arrived at by various methodologies, and compared them, the following tabulation took shape :
Let us take the case of a tractor which is valued at Rs. 5 Lakhs in 2009. The depreciation chart by various methods would read thus :
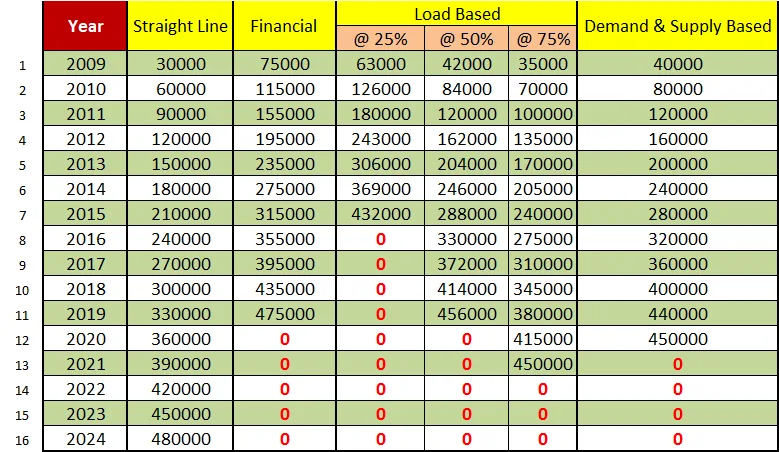
Interpretation : For an asset valued at Rs. 5 Lakhs, in 2018, straight line method would value the asset at Rs. 200000/-, the financial method would value it Rs. 65000/-, and Demand / Supply Method would value it at Rs. 60000/-, while optimal load method would value it @ Rs. Rs. 120000/-. The Value band would be between Rs. 60000 – Rs. 200000/-.
Considering the Straight line to be largely theoretical, if we remove that method, the band comes between Rs. 65000 – Rs. 150000/-. We may safely make a funding offer upto Rs. 50000/- in such a case.
SCHOOL OF THOUGHT 3 - STANDARD DEVIATION INFLATION INDEX METHOD
This school of thought believes in a one-time exercise, where you arrive at a set of values - Brand wise.
Standard Deviation is defined as "a quantity expressing by how much the members of a group differ from the mean value for the group."
So how is it important to us ?
- Every model has a pricing pattern for its new models.
- Take up the popular selling models and compare them year on year and trace the movements.
- Take up the low selling models and compare them year on year and trace the movements.
- These will aid in arriving at a Brand Wise Standard Deviation.
In many cases, the original Invoice is not available. To apply depreciation, we need to be sure of the rate that was paid originally. To arrive at this, this standard deviation has been very useful.
This method believes that the standard deviation is more or less consistent in a period of 8 -10 years and hence considering the deviation as the discounting factor works more accurately.

This also mirrors the 8 year economic cycle and believes that a pattern measured over a period of 8 years is sufficient to be patterned.
SCHOOL OF THOUGHT 4 – USAGE
This is a slightly more complex model combining 3 or 4 factors based on verification by an officer / employee, and will be judged on case to case basis :
USEFUL LIFE OF A TRACTOR :
The engineering annals peg this @ 15 years. Yet the Financing systems follow something called the Modified Accelerated Cost Recovery System (MACRS), which pegs the life @ 8 years.
COMBUSTION QUALITY :
Smoke that is emitted after combustion of fuel
: i. Transperant, ii. Black, iii. Bluish, iv. White
Each of these have a meaning to communicate.
LUG QUALITY :
I quote H J Hine, in this context, who has researched very widely. On the importance of Lugs, he says, "An Inspection of the impressions left in the soil by the lugs of the wheels when the tractor is pulling its load will give sufficient guide to whether any excessive slip is taking place. "
HOUR METER READING :
The first question that crops in all our minds is how many Hours per year is ideal ? It has been pegged at 350, 450, 600, 750 and in some organizations 1000. Yet 600 - 750 would be a good start. This metric tells us two scenarios to be careful about :
(a) Usage below 300 hours per annum
(b) Usage above 1500 hours per annum
Combining the four, an annual depreciation between 8 – 18% per annum will be decided for the first year and a similar such percentage will be arrived at based on the risk appetite.
SCHOOL OF THOUGHT 5 – HP BASED DEPRECIATION
This school of thought clearly propounds five classes of vehicles and has observed different depreciation scales applicable to them.
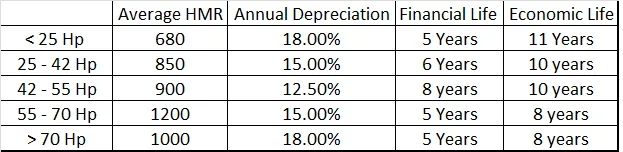
This theory observes that the usage of each horsepower defines the depreciation and average HMR. The samples taken in each segment were from the same geography and were homogenous in purpose. Multiple lots of the same model taken from other geographies showed same characteristics up to 70 % similarity. Hence the grouping in this theory was also found to be significantly impactful in inference.
******
Many a time, we may encounter market specifying rates which are lower than rates that we have arrived by logical methods. Market will continue to be the final guide. Yet, to be able to say that our GRID conforms to all logical approaches and is more conservative in assessment is the objective of an algorithmic model or GRID model. The organization should not be impacted by exposing itself to funding higher amounts than is feasible.
It is up to us to decide which school of thought we would like to subscribe to. There are different profiles / customers, which can be addressed in each type, and each need deeper understanding. Yet, the entire exercise made me just realize, how much more there is to be done and understood in this lovely industry of tractor financing.
So the next time, a dealer / manufacturer rattles off figures of popular models, it would be ideal to understand the rationale / logic in arriving at those values rather than merely recording them as market information. What is recorded in these pages are also market information. It is what you make them out to be finally – STATISTICS OR DATA…
Archive note
This essay was restored from Vivek Krishnan’s LinkedIn archive. Its original wording and available visuals have been preserved.
This page is now the permanent canonical edition within Vivek Perspective.